In QA view. Choose an Environment (for example, Production, Development) and a Period (7, 14, or 30 days). The dashboard refreshes to show metrics for that scope.
KPI Tiles
Key metrics for the selected environment and period.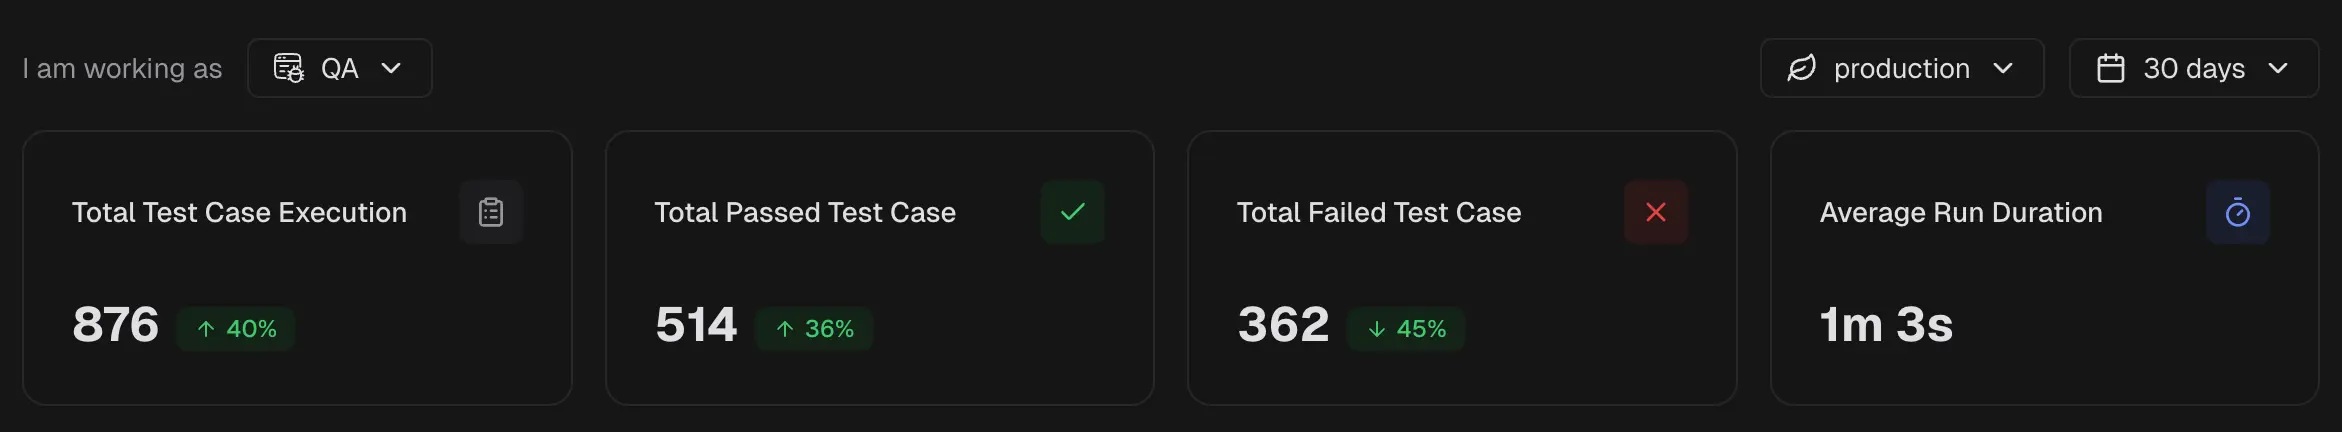
1. Test Case Executions
Number of tests cases executed in the selected period. Helps QA and managers gauge coverage and CI activity.2. Passed Test Case
Count of tests that passed. Helps managers read stability and QA confirm that recent fixes hold.3. Failed Test Case
Count of tests that failed. Direct queue for QA triage and for developers to pick up fixes.4. Average Run Duration
Average time per test run. Helps developers spot slow suites and managers track pipeline efficiency.Most Flaky Tests
Tests that pass and fail across runs, ordered by flakiness.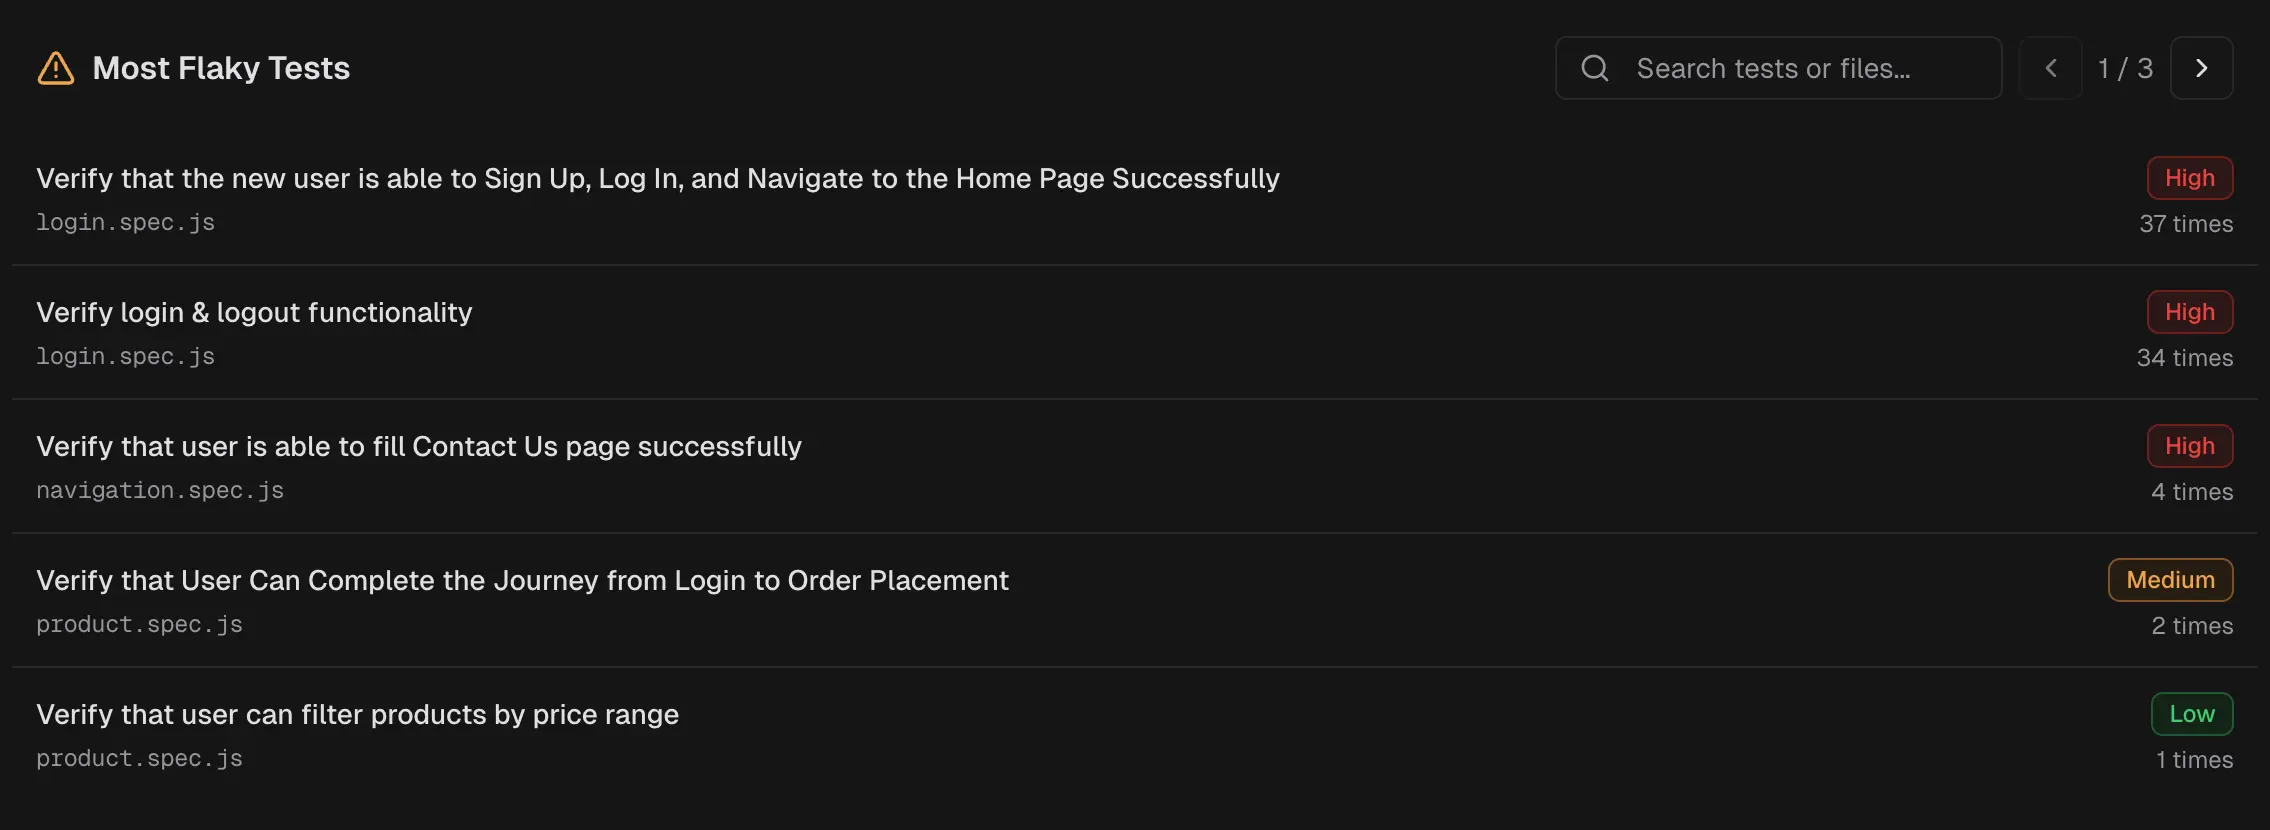 Tests that pass and fail across runs. Helps QA prioritize stabilization and developers target fragile areas.
Each test is also clickable to immediately view the latest run for that test.
Tests that pass and fail across runs. Helps QA prioritize stabilization and developers target fragile areas.
Each test is also clickable to immediately view the latest run for that test.
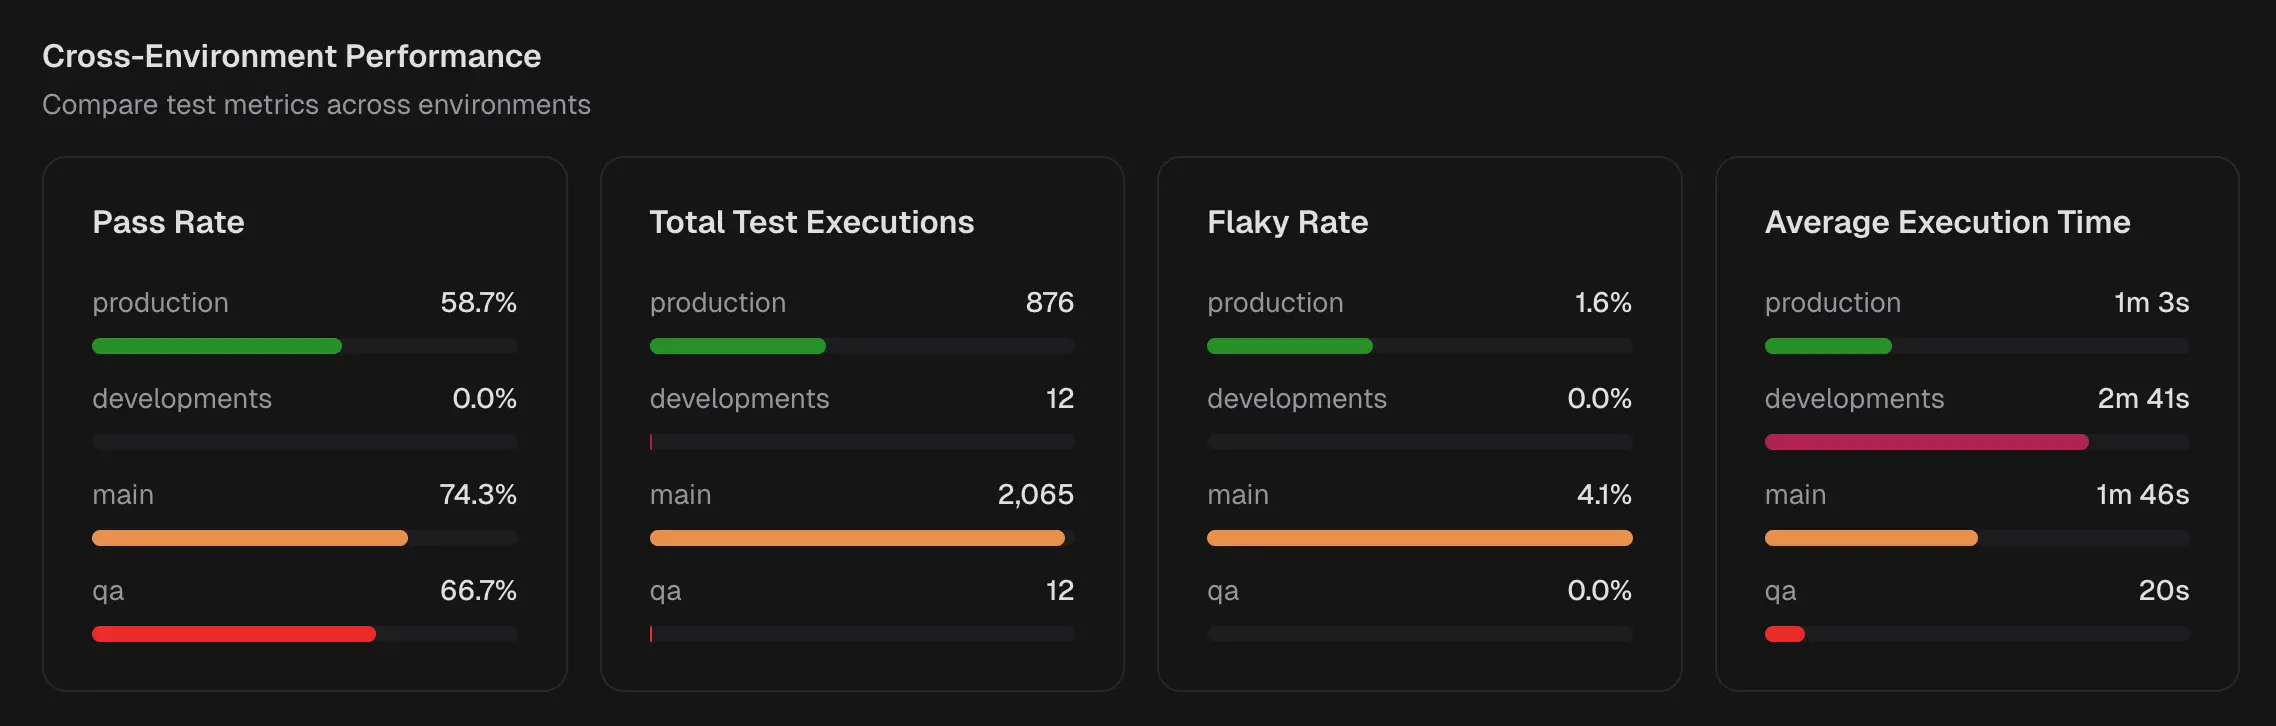
Cross-Environment Performance