Search and Filters
| Controls | Purpose | Options |
|---|---|---|
| Search | Find runs by text or ID | Commit message, run number (for example, #1493) |
| Time Period | Limit runs to a date range | Last 24 hours, 3 days, 7 days, 14 days, 30 days, Custom |
| Test Status | Filter by outcome | Passed, Failed, Skipped, Flaky |
| Duration | Sort by runtime | Low to High, High to Low |
| Committer | Show runs by author | Select one or more committers |
| Environment | Focus on a mapped environment | production, development, hotfix |
| Branch | Scope by branches | Select one or more branches |
| Tags | Filter by run-level or test-case-level tags | Switch between Test Run and Test Case tabs, then select one or more tags |
Active Test Runs
Runs currently executing appear in a collapsible Active Test Runs section at the top of the list. Results update in real time as tests complete. Each active run displays a progress bar, live pass/fail/skip counts, commit, branch, and CI source.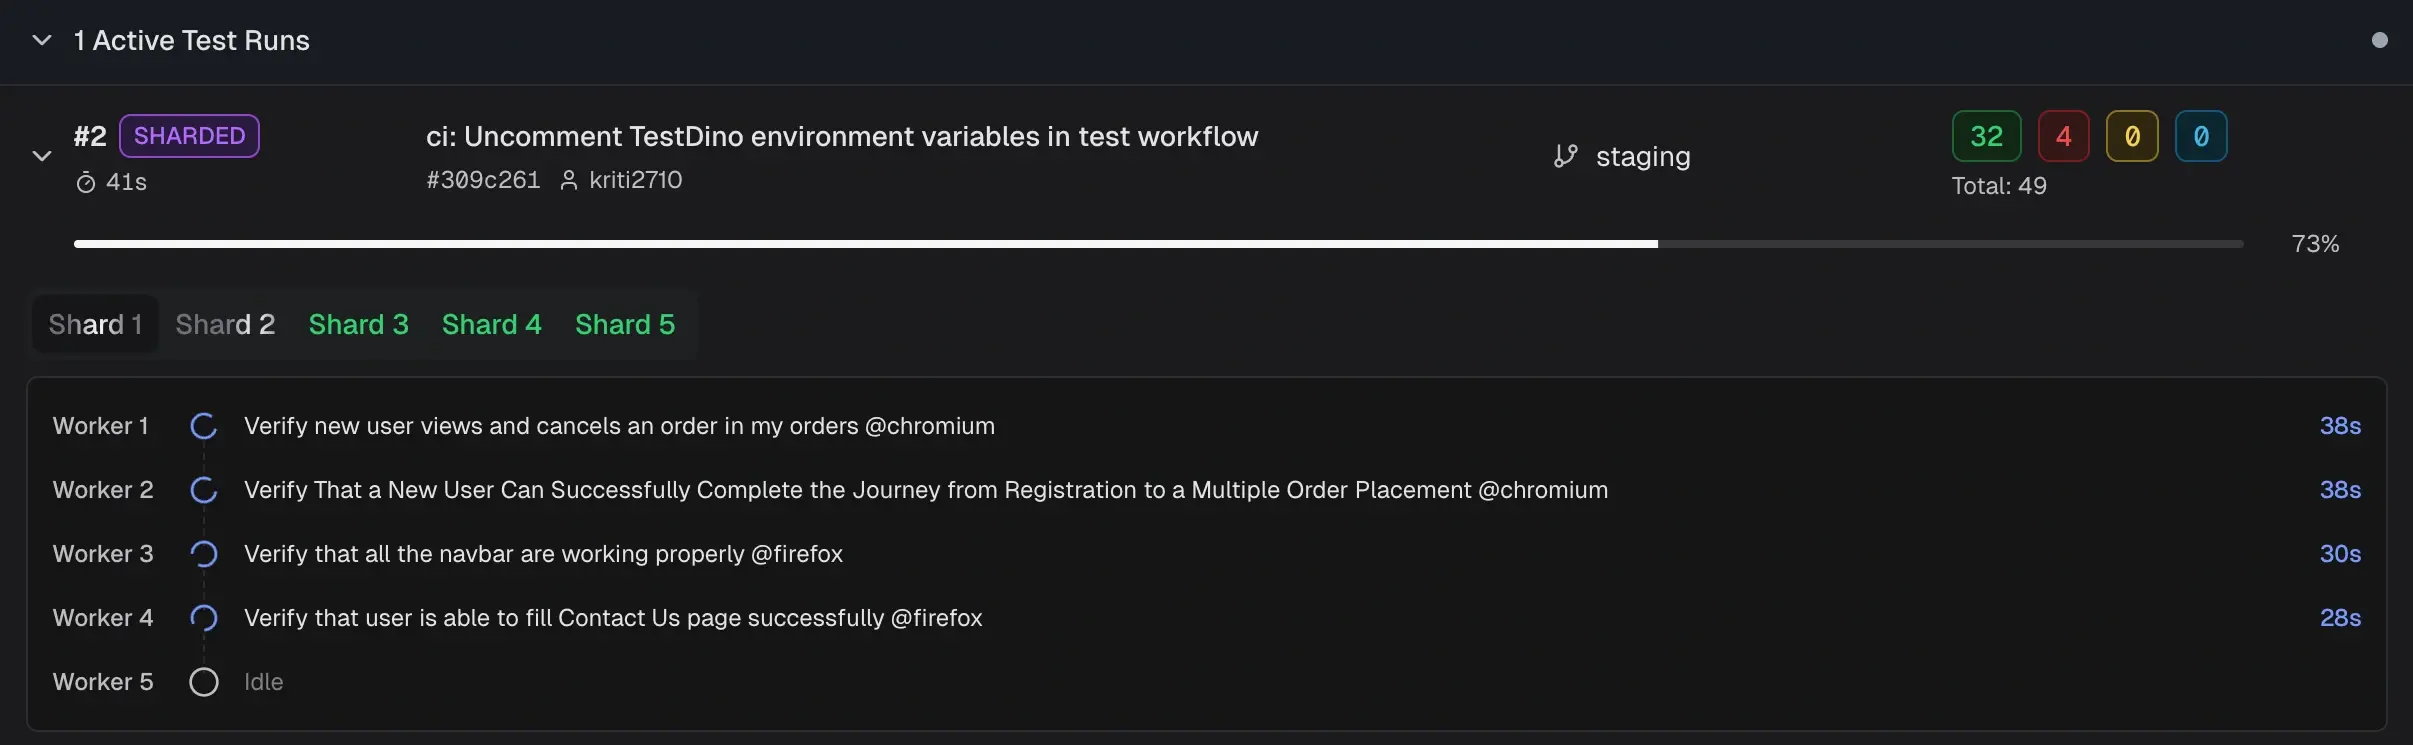 For sharded runs, the run is labeled SHARDED with tabs for each shard. Select a shard tab to view its workers and currently executing tests. Non-sharded runs show a single progress bar with per-worker detail.
Test Run Key Columns
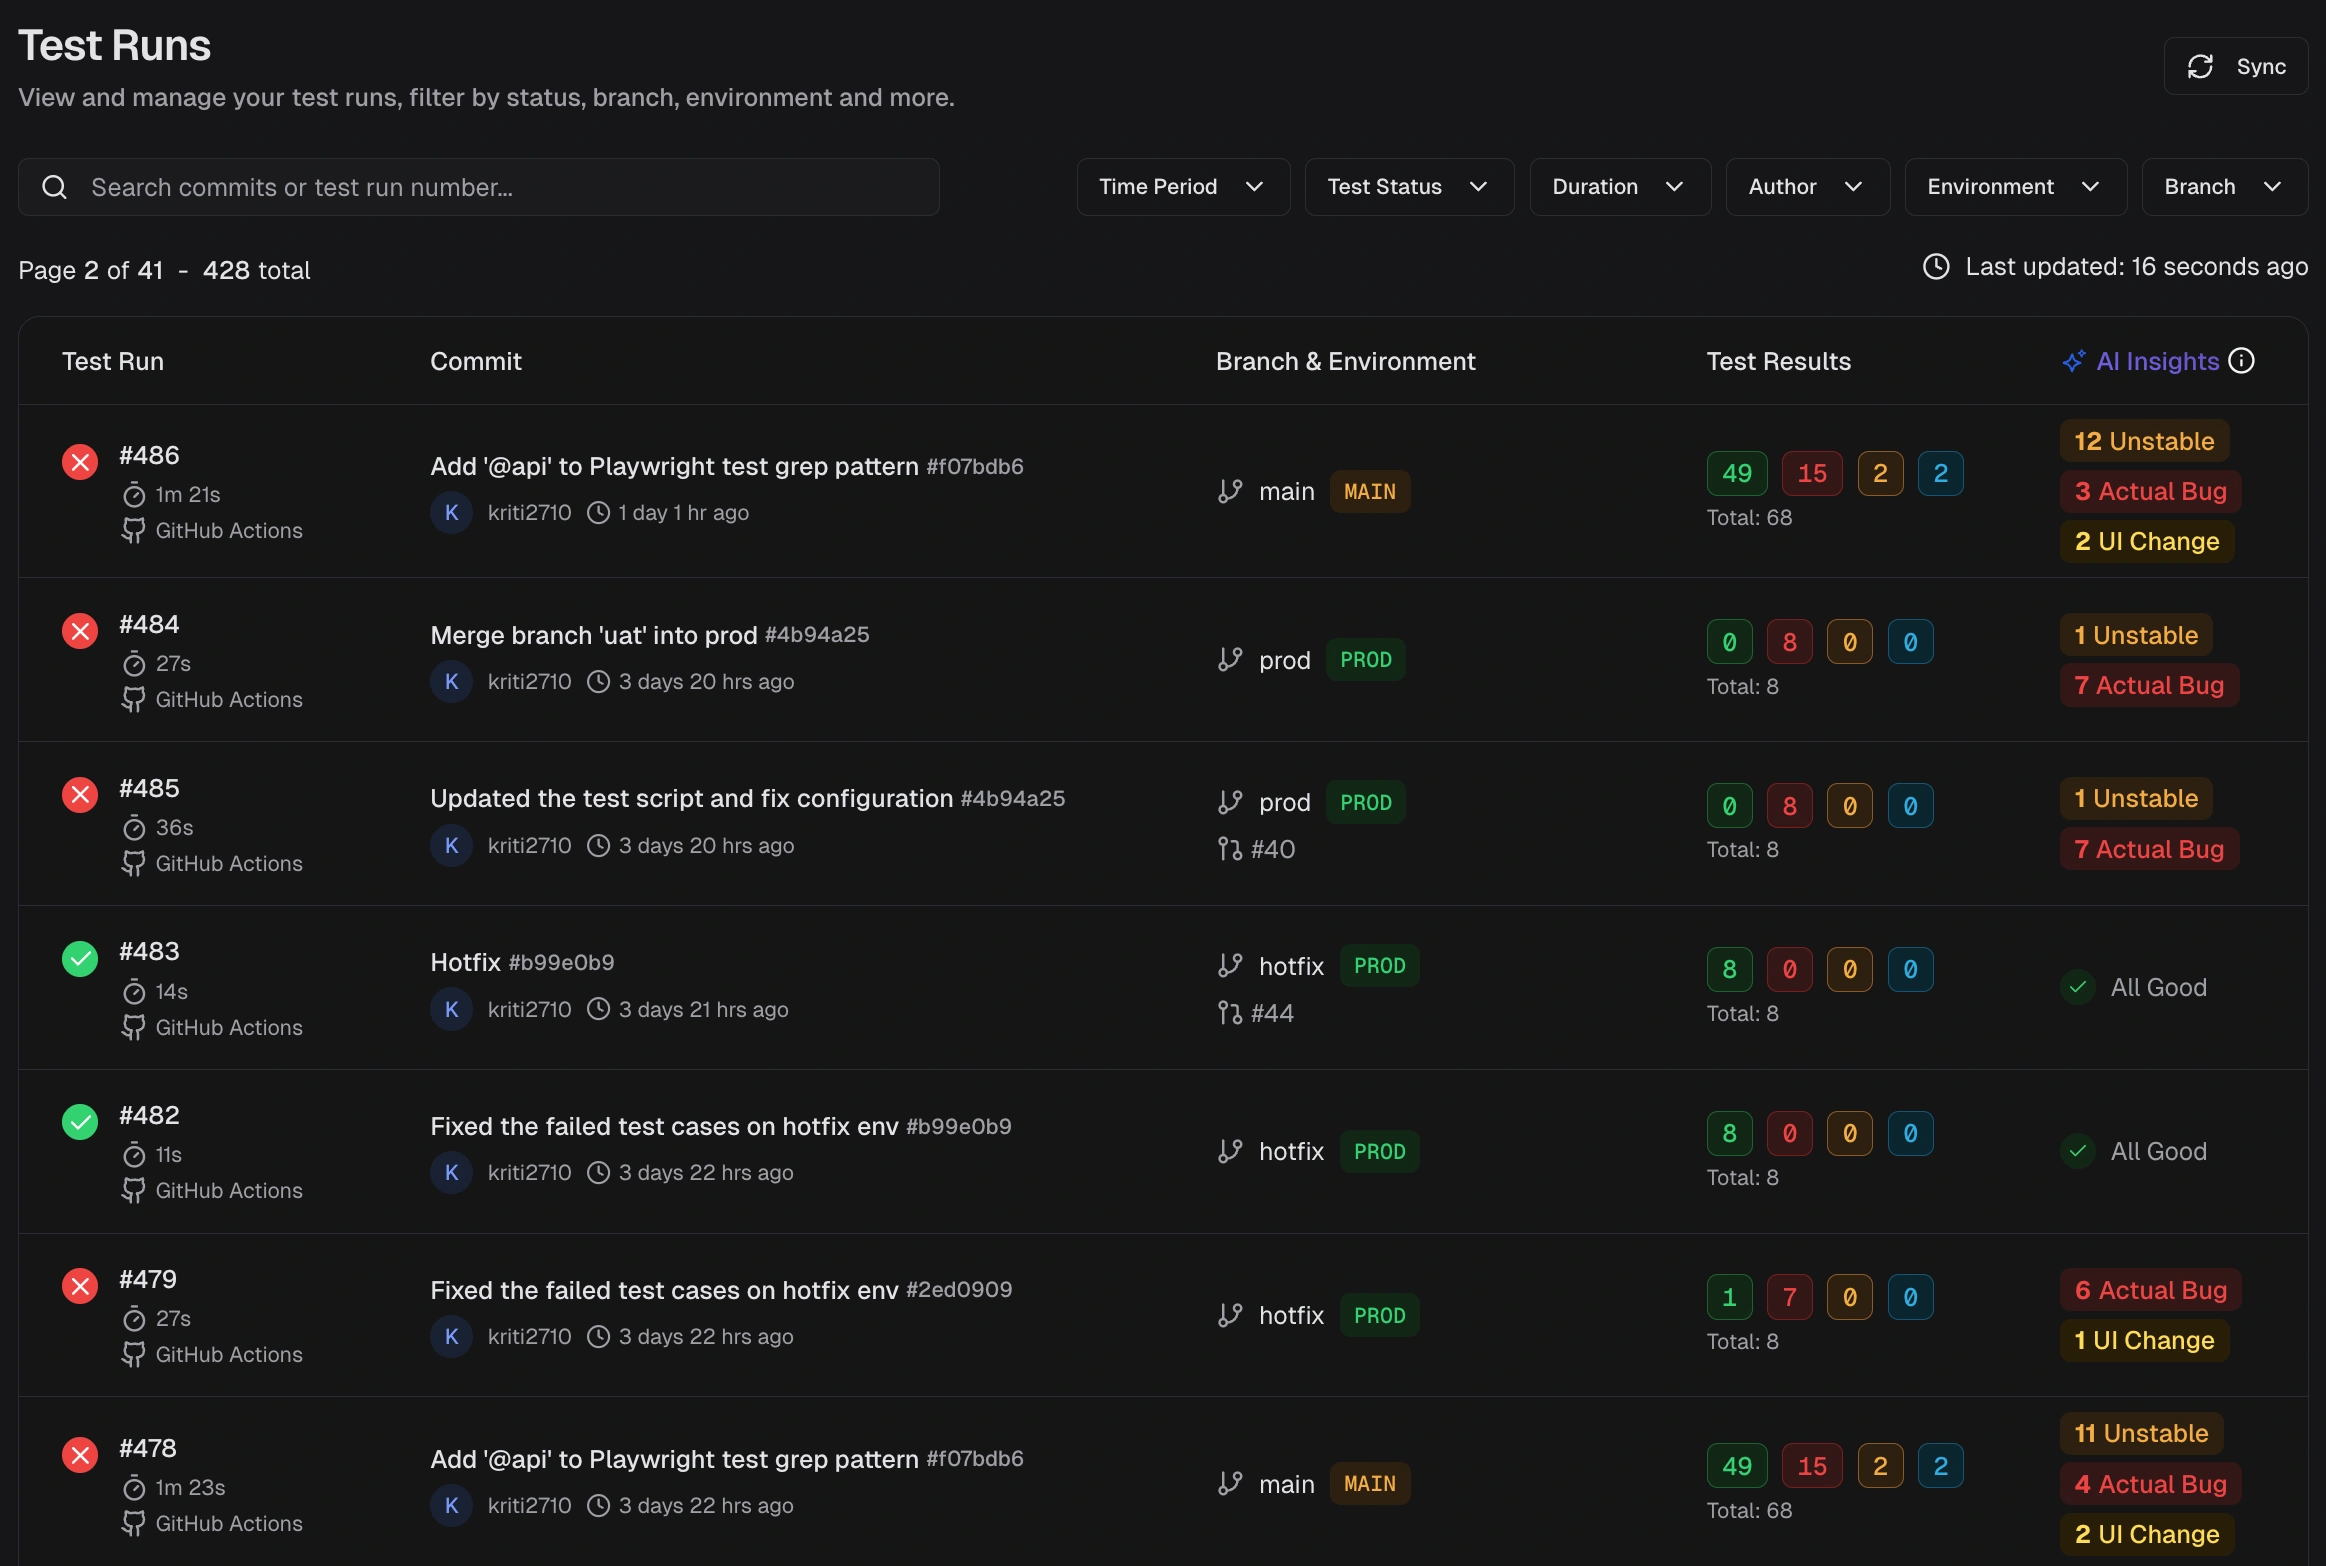
| Column | Description |
|---|---|
| Test Run | Run ID, start time, and executor (CI or Local). Click the CI label to open the job. |
| Commit | Commit message, short SHA, and author. Links to the commit in your Git host. |
| Branch & Environment | Branch name and mapped environment label. Environment labels come from branch mapping. |
| Test Results | Counts for Passed, Failed, Flaky, Skipped, Interrupted and total. |
| AI Insights | Category counts for Actual Bug, UI Change, Unstable, and Miscellaneous. |
Test Run Grouping
Runs that share the same commit hash and commit message are grouped as attempts by TestDino. This usually happens when you rerun a CI workflow or trigger multiple executions for the same commit. Expand the group to see each attempt (for example, Attempt #1, Attempt #2). This grouping helps you:- Track reruns for a single commit without scanning separate rows
- Compare results across attempts to confirm if a rerun fixed flaky failures
- See how many times a workflow was triggered for the same code change
Run-Level Tags
Attach labels to an entire test run using the--tag CLI flag. Tags appear as chips on each run row in the list and are available as filter values.
| Tag type | Set via | Scope | Example |
|---|---|---|---|
| Run-level | --tag CLI flag | Entire test run | regression, sprint-42, nightly |
| Test-case-level | Test annotations | Individual test cases | smoke, critical-path, login |
Quick Start Steps
- Set scope - Filter by Time Period, Environment, Branch, Committer, Status, or Tags, and sort by Duration to focus the list.
- Scan and open - Review result counts and AI labels, then open a run that needs action.
-
Review details - The run details page provides six tabs:
- Summary: Totals for Failed, Flaky, and Skipped with sub-causes and test case analysis
- Specs: File-centric view. Sort and filter to identify slow or falling specs.
- Errors: Groups failed and flaky tests by error message. Jump to stack traces.
- History: Outcome and runtime charts across recent runs. Spot spikes and regressions.
- Configuration: Source, CI, system, and test settings. Detect config drift.
- Coverage: Statement, branch, function, and line coverage with per-file breakdown.
- AI Insights: Category breakdowns, error variants, and patterns for new or recurring issues.
Related
Explore runs, CI optimization, and streaming.Summary
Group failures and flakiness by cause
Detailed Analysis
Drill down to specific tests
Specs View
Review results by spec file
Errors View
Group failures by error message
Historical Trends
Spot regressions and drift
Configuration Context
Debug environment differences
Coverage
Per-run code coverage breakdown
AI Insights
Error clusters and patterns
Test Case Details
Individual test analysis